

Debugger#
JupyterLab ships with a Debugger front-end by default.
This means that notebooks, code consoles and files can be debugged from JupyterLab directly!
Requirements#
For the debugger to be enabled and visible, a kernel with support for debugging is required.
Here is a list of kernels that are known to be supporting the Jupyter Debug Protocol:
xeus-python: Jupyter kernel for the Python programming language
xeus-robot: Jupyter kernel for Robot Framework
ipykernel: IPython Kernel for Jupyter
common-lisp-jupyter: Common Lisp Kernel for Jupyter
Other Jupyter Kernels can also support debugging and be compatible with the JupyterLab debugger by implementing the Jupyter Debugger Protocol.
If you know of other kernels with support for debugging, please open a PR to add them to this list.
Here is an example of how to install ipykernel and xeus-python in a new conda environment:
conda create -n jupyterlab-debugger -c conda-forge "jupyterlab>=3" "ipykernel>=6" xeus-python
conda activate jupyterlab-debugger
Usage#
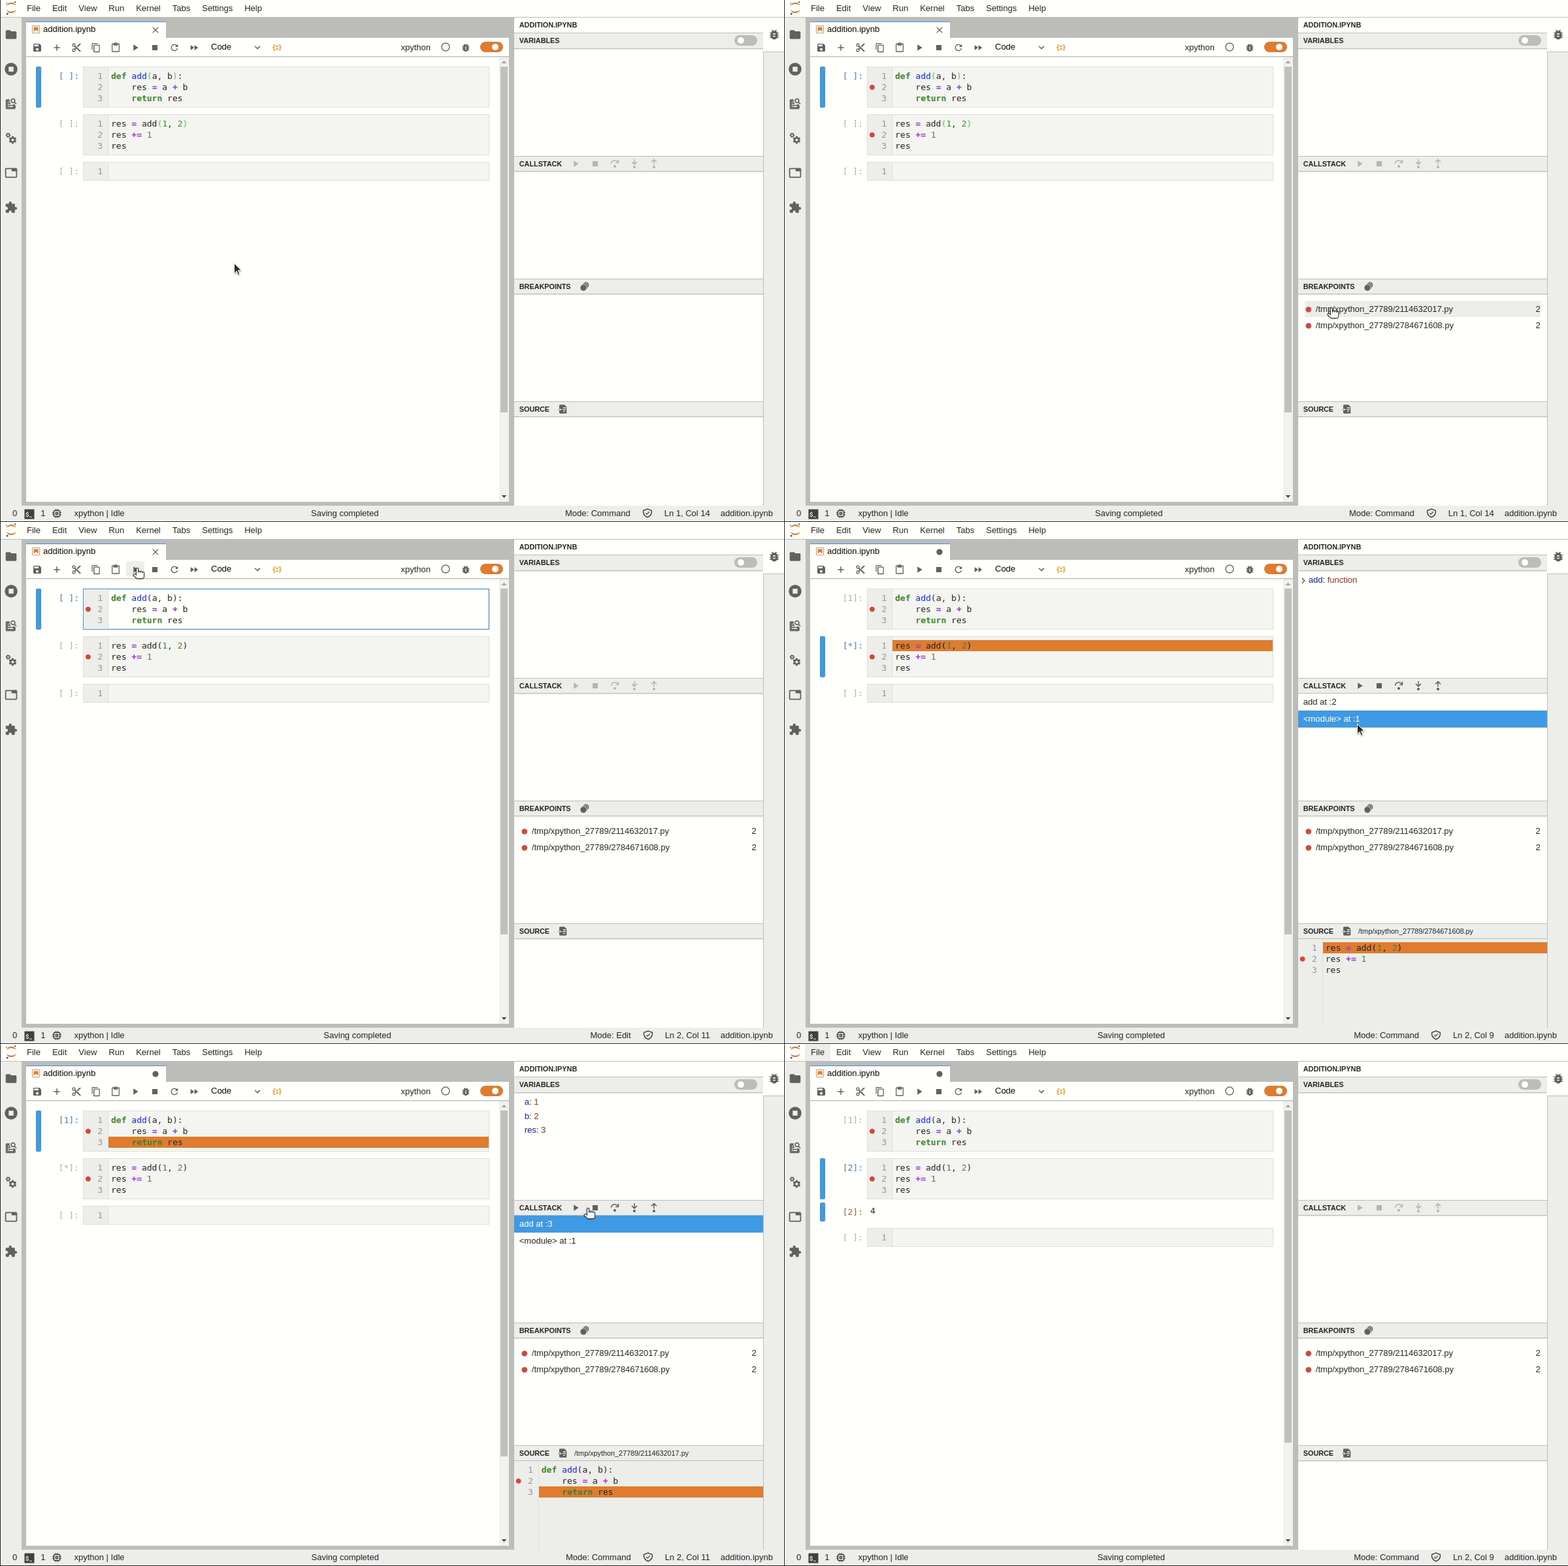
Here is a screencast to enable the debugger and set up breakpoints. The various steps are described more in depth below.
Use a kernel supporting debugger#
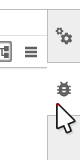
First, you will need to check that the kernel supports debugging. If so, the bug icon in the upper-right corner of the notebook will be enabled.

Debug code in notebook#
Now let’s enable the debugger for this notebook. The debugger can be enabled by toggling the bug button on in the upper-right corner of the notebook:

Once debugging has been enabled, we can set breakpoints and step into the code.
Let’s define a function that adds two elements:
def add(a, b):
   res = a + b
   return res
We can call the function and print the result:
result = add(1, 2)
print(result)
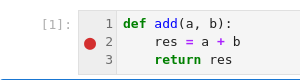
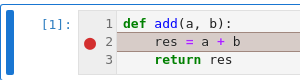
Now let’s go back to the first code cell and click on the gutter on line number 2 to add a breakpoint:
Then let’s execute the second code cell by clicking on the _Run_ button:
The execution stops where the breakpoint is set:
Explore the code state#
You can explore the code state with the debugger sidebar. It shows a variable explorer, a list of breakpoints, a list of kernel sources and enables navigating the call stack.
The sidebar may also include a source preview if “Show Sources in Main Area” setting is turned off.
Variables
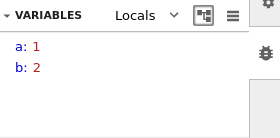
The variables panel lists the variables defined in the frame selected in the call stack. The drop down of its toolbar switches between the Locals of that frame and the Globals of the module it belongs to.
Variables can be explored using a tree view and a table view, which are toggled with the two buttons on the right of the toolbar. The tree view shows the value of each variable, and expanding an entry reveals the variables it contains:
The table view shows the type of each variable next to its value:

In the table view, double-clicking a variable which contains other variables - or choosing Inspect Variable in its context menu - opens its contents as a table of their own in the main area:

Variables whose value is too large to read in the panel can be opened on their own. When the kernel supports it, hovering over a variable in the tree view reveals a magnifying glass button which renders the variable in the main area, using the same renderers as notebook outputs - so an image is displayed as an image, and a data frame as a table:

The panel refreshes as you step through the code, and is closed together with the document it was opened from. The same command is available as Render Variable in the context menu of the variables panel, together with Copy to Clipboard, which copies the text representation of the value, and Copy Variable to Globals, which copies a local variable to the global scope of the kernel, where it remains reachable once the execution has resumed.
Kernels expose internal variables which are rarely of interest. The variables listed for the kernel in use in the Variable filter setting of the Debugger section of the Settings Editor are hidden from both views.
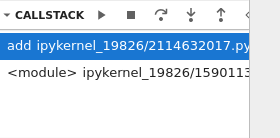
Call stack
You can step into the code, and continue the execution using the debug actions:
Breakpoints
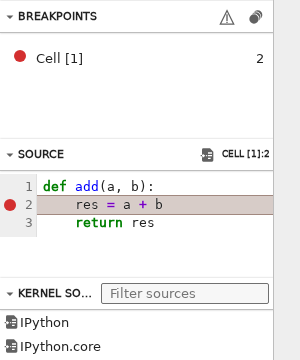
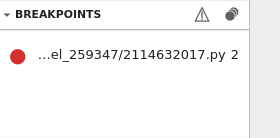
New breakpoints can be added and removed while the execution is stopped, and they will be shown in the list of breakpoints:
Source
By default the source of the current file being debugged will show up in the main area in a read-only editor view. The auto-opened source view widget will auto-close when the debugger steps into another file, or when the debugging session ends.
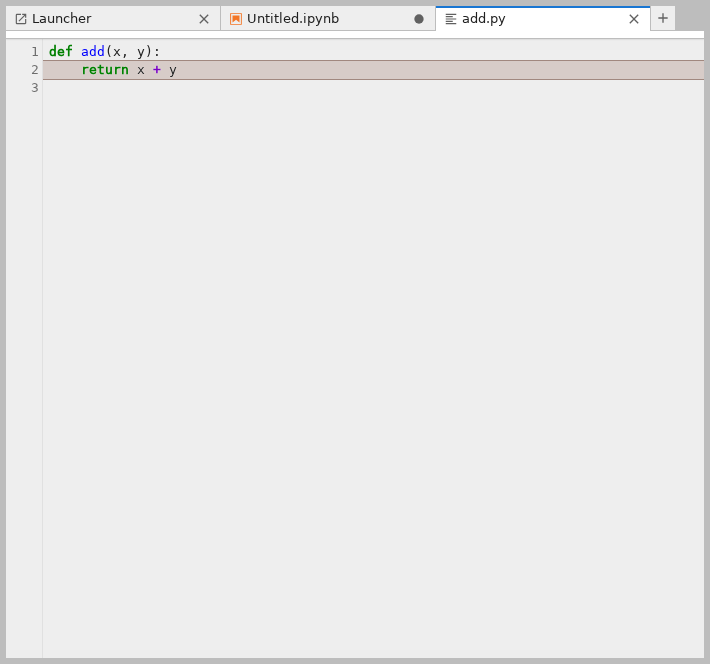
If you would like to keep the source view open for longer, you can manually open it by clicking on the file in the “Kernel Sources” panel as manually opened files will not auto-close.
If you prefer the source to show up in the sidebar instead, you can turn off the “Show Sources in Main Area” setting in the Settings Editor which will make it display as another panel: